learn more

WinWerth® measurement software

The universal measurement software for coordinate measuring machines with optics, probe, computed tomography and multi-sensor systems

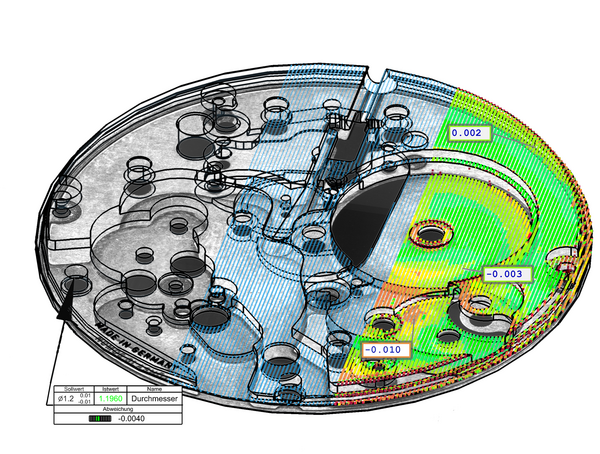
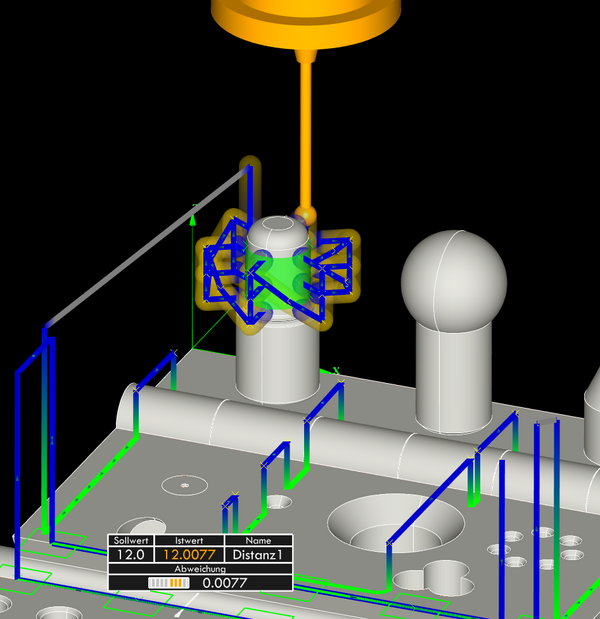
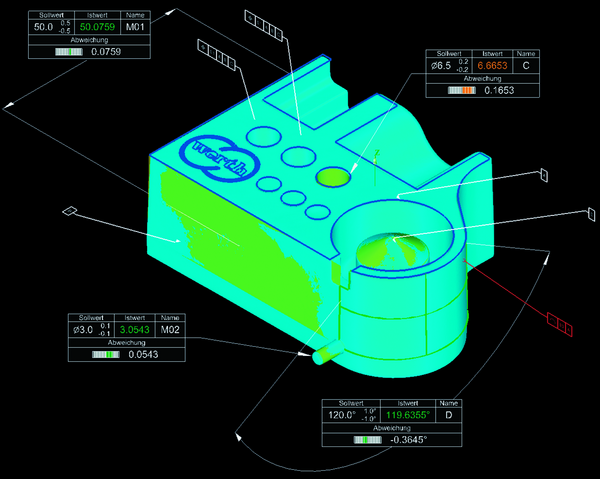
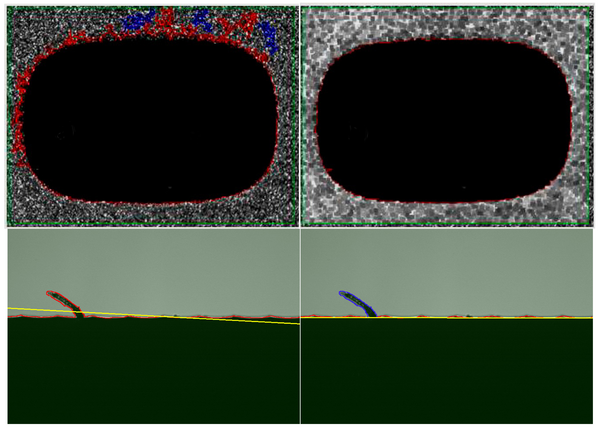
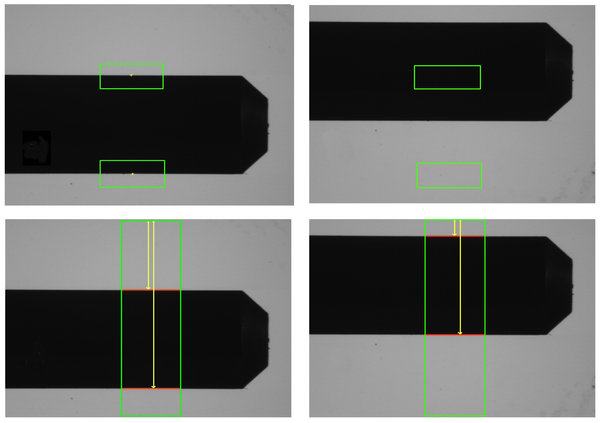
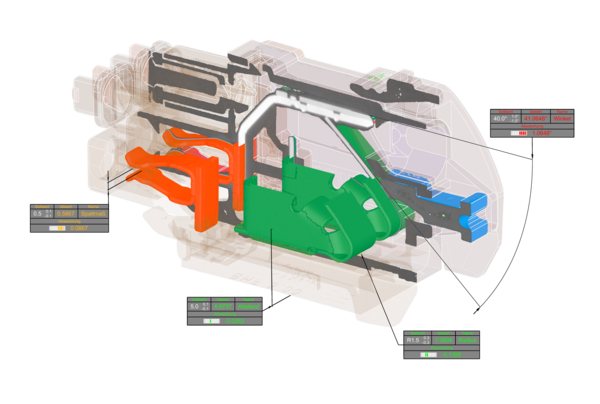
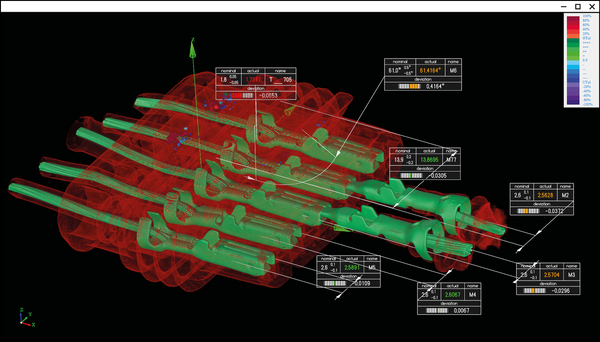
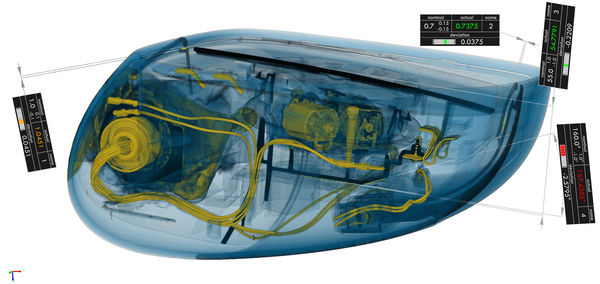
The operation of machines with a wide variety of sensors, but also the evaluation of volume data and point clouds are possible with WinWerth® in a unique combination. The Werth image processing software is based on 40 years of experience and is the foundation of probably the most powerful image processing sensors for coordinate measuring machines currently available. Optical distance sensors, conventional styluses in single-point or scanning mode, the Werth Fiber Probe®, X-ray computed tomography or machines with a combination of several sensors are all supported by the uniform concept. Measurement points, 2D images or volume data can also be conveniently evaluated in terms of geometrical characteristics or with part-to-part deviation analysis. PTB-certified evaluation algorithms ensure correct measurement results. All desired information is displayed in the graphic: CAD models with PMI data, voxel volumes, measurement point clouds, colour-coded deviation plots from 3D nominal-actual comparisons, video images, measurement and calculation elements as well as flags with nominal and actual values, tolerances and deviations. In order to meet the most diverse requirements, the software has a modular structure. Various machines can be operated, from simple measuring projectors to complex multi-axis coordinate measuring machines with multi-sensor systems or even X-ray tomography sensors.

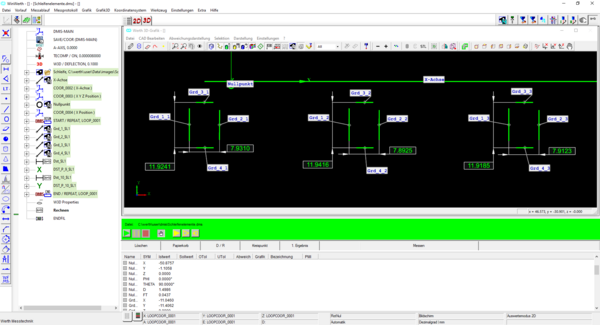
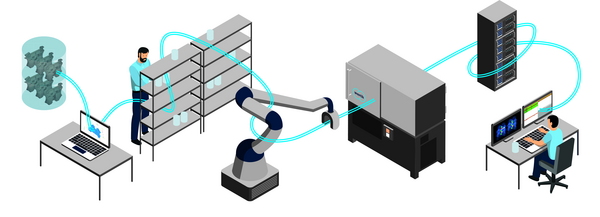
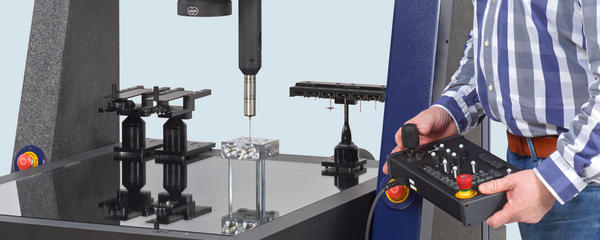
Modern coordinate measuring machines cover a wide range of differently complex tasks. The qualifications of the machine operators range from employees with little training, who only occasionally determine a few sizes, to specialists who, exploiting all technically feasible options, also handle very difficult measuring tasks. The very different working methods are optimally supported by the structure of the WinWerth® software for device operation. For example, there are several access levels that are adapted to the different qualification levels of the operators. Interfaces to CAD systems for target data import and to CAQ systems for statistical evaluation enable the adapted integration of the coordinate measuring machines into company software structures.

 
Simple graphic user interface measurement

Image processing measures almost by itself

In practice, a few sizes of production parts often have to be determined "quickly". This task is also carried out by employees who do not permanently deal with the operation of coordinate measuring machines. To enable effective work in this environment, the operation is limited to the most necessary. The "intelligence" of the WinWerth® measurement software then takes over, for example, the exact determination of the object area to be captured, the selection of the geometrical element to be measured (e.g. e.g. straight line, circle, corner point) as well as the linking algorithms for determining geometrical characteristics such as distances, angles and diameters.

Simple graphic user interface measurement - Image processing measures almost by itself
Operator guidance through WinWerth® tutorials

Operator guidance through WinWerth® tutorials

WinWerth® tutorials accompany the user step by step, for example when performing a tomography scan. Dialogues with text and images explain the Individual operating steps, supported by highlighting of the relevant operating fields. This allows complex programming steps to be carried out quickly and easily, even by inexperienced operators.

Measurement points are distributed automatically

For more complicated measurement tasks, the operator can take over parts of the automatic processes (setting windows, selecting features) themselves and familiarise themselves step by step with the more detailed control of the measurement sequences. For support, measurement points or scan lines are automatically distributed on the geometry elements to be measured, e.g. as circles, cylinder surface lines, stars or spirals, taking into account the necessary traverse paths. The complete measurement sequence, including evaluation, is first created offline using the CAD model or online with the minimum number of points for the respective geometry element. Measurement points and scan lines can be subsequently moved, deleted or added with the mouse or via a dialogue. Measurement sequences specified in this way can be saved and called up as an automatic sequence in the event of repetition.

Measurement points are distributed automatically
 
Programming of complex measurement sequences - User-friendly display of the test plan in the user interface
Programming of complex measurement sequences

User-friendly display of the test plan in the user interface

The programming of the measurement sequences is supported by the corresponding tools of the WinWerth® measurement software. The sensors are selected directly on the user interface of the multisensor coordinate measuring machine. A "feature tree" represents the test plan and thus the structure of the measurement programme in a tree-like structure. This visualises the relationships between geometrical characteristics, geometry elements and technology parameters such as sensor type, illumination setting, scanning speed, evaluation algorithm and valid alignment. Parallel to the feature tree, the geometric features and the features with the associated measurement results are also displayed in the graphical representation of the measurement sequence and in the numerical measurement log. Linking operations to geometric elements (intersection point, intersection line) or geometrical characteristics (distance, perpendicularity) can be programmed either in the feature tree or in the graphical view.

Simulation of the tomography process with TomoSim

TomoSim is the first coordinate measuring software to simulate the tomography process offline using CAD data or a point cloud in STL format. The realistic simulation, taking into account the set CT parameters, enables the calculation of a volume including all significant artefacts. For example, an initial sample inspection programme can be taught in at an offline workstation in parallel with the production of the first workpiece and the performance of other measurements on the machine using the WinWerth® measurement software. This enables TomoSim to speed up processes and reduce downtimes, e.g. for TomoScope® machines in multi-shift operation.

In addition to a completed program creation and feasibility check in time for the completion of the first workpiece, the simulation of the tomography process allows CT parameters to be tested and optimised. With the help of the simulated volume, significant artefacts, e.g. due to beam hardening or too few rotary increments, can be detected and, if necessary, an appropriate artefact correction can be selected. Another new feature is the complete offline programming of volume-based analyses such as burr detection, void analysis, porosity analysis, text recognition, SurfaceScan Predefined or in volume sections.

Simulation of the tomography process with TomoSim
Testing and changing made easy

Testing and changing made easy

The feature tree in the WinWerth® user interface is also used to control the test and change mode, in which programmes can be processed step by step and changes can be added. A parallel text editor allows experienced operators to directly enter or change the DMIS programme code while teaching in programmes. A programme part can be defined as a loop for repeated processing or outsourced as a subroutine by selecting it with the mouse. Selected functionally relevant test dimensions can be determined using feature-oriented measurement.

 
Measurement with CAD data

Simple operation with CAD-Online®

Another benefit of the CAD module integrated in WinWerth® is that the CAD information can be used to position the coordinate measuring machine. Werth was probably the first manufacturer of coordinate measuring machines to introduce this technology back in the mid-1990s under the name CAD-Online®. The entire measurement sequence can be controlled by selecting the geometric features on the CAD model. The measuring machine automatically moves to the generated measuring positions and measures with the selected sensors.
In this way, for example B. automatically capture measurement points as point clouds or measure larger areas with the Werth 3D Patch or confocal sensors by automatically aligning the individual measurements in high resolution. Technology parameters such as the illumination setting for the image processing sensor can be set directly on the measuring machine, taking into account the interaction between the illumination, measuring object and imaging system. Collisions are avoided by automatically modifying the movement sequences based on the workpiece and machine or sensor geometry.

Measurement with CAD data - Simple operation with CAD-Online®
Time-saving programming with CAD-Offline®

Time-saving programming with CAD-Offline®

The WinWerth® measurement software can also be operated on a CAD-Offline® workstation without the measuring machine. Werth was also a pioneer in this area and supplied solutions to customers back in the early 1990s. Here, the test programmes are only created and tested on the CAD model. Particularly in the case of tactile sensors, this often results in time savings of several hours when creating measurement programmes without positioning on measurement points and clearance positions. The device simulation for offline programming is carried out on the 3D CAD model of a workpiece. Collision analysis takes place in the background. CAD-Offline® saves expensive machine time. The test plans are already finalised when the first workpiece or measuring object is manufactured. Influencing factors related to the measurement object can then be reworked in a test run in single-step operation. Online and offline work can be carried out with a consistent operating concept from a single source and the "correctness" of the measurement results is ensured. This is not the case with programming workstations that are independent of the measuring device manufacturer.

PMI information makes work easier

Many CAD systems now offer the option of integrating PMI (Product and Manufacturing Information) data. In addition to the geometry description of the CAD features, the resulting CAD data sets also contain the dimensions defined by the designer. When the geometrical characteristics are selected, the WinWerth® measurement software distributes measurement points or scan lines on all geometrical elements that are to be linked to find a solution, and the measurement sequence is created at least partially automatically. Unfortunately, this solution is still not widely used due to the increased requirements when creating the CAD model.

If the complete measurement sequence is to be generated fully automatically, all the necessary parameters must be stored in the PMI data or determined automatically by the measurement software. If these requirements are met, the complete measurement sequences for the measurement of close-tolerance metal tools for the production of injection moulds for contact lenses, for example, can be created fully automatically in WinWerth®. The measurement is carried out with a multisensor coordinate measuring machine using a combination of optical distance sensors with image processing and with the aid of an automatic rotary/tilt axis for the workpiece.

PMI information makes work easier
 
Werth image processing - Analysing images perfectly for optics and computer tomography scans
Werth image processing

Analysing images perfectly for optics and computer tomography scans

The image processing algorithms used to analyse the image content and determine the measurement points also have a significant influence on the quality of the measurement results from image processing sensors or the evaluation of cross sections when scanning tomographically. Today, evaluation is mainly realised using PC hardware and software. In a first processing step, the image can be improved with image filters (optimising contrast, smoothing surface defects). This enables reliable measurements even with difficult edges and rigid scanning in incident light.

Contour image processing for reliable measurement

Contours larger than the field of view of the respective lenses can be captured as a whole using automatic contour tracking in conjunction with the CNC axes of the coordinate measuring machine (contour scanning). This scanning method is well suited to checking a few relatively large contours, e.g. on punching tools. 
Another method for capturing larger areas of the workpiece is "raster scanning HD" (patent). Here, the image processing sensor captures images of the workpiece at high frequency during movement. These are resampled and superimposed to create an overall image with a resolution of up to 20,000 megapixels. In this way, for example, 100,000 small bores on large fibre couplers are measured in just 35 minutesb instead of 7 hours. Accuracy is also increased by measuring even large areas at high magnification and averaging over several images, which improves the signal-to-noise ratio. The process can be customised to the requirements of the measurement task.
With Raster Scanning HD P, image acquisition only on areas of interest using a preset path results in a further reduction in measurement time and data volume compared to rectangular raster scanning of the entire workpiece with Raster Scanning HD N. On rotary axis devices, Raster Scanning HD ROTARY enables image acquisition during rotation with measurements on the "unrolled" overall image of the lateral surface of rotationally symmetrical workpieces.

Contour image processing for reliable measurement
Please accept "Other" in the settings to watch this video.Raster scanning: resolution independent of the measuring range

Raster scanning: resolution independent of the measuring range

Contours larger than the field of view of the respective lenses can be captured as a whole using automatic contour tracking in conjunction with the CNC axes of the coordinate measuring machine (contour scanning). This scanning method is well suited to checking a small number of relatively large contours, e.g. on punching tools.

Another method for capturing larger areas of the workpiece is "raster scanning HD" (patent). Here, the image processing sensor captures images of the workpiece at high frequency during movement. These are resampled and overlaid to create an overall image with up to 4000 megapixels (as of 2021). In the "in the image" evaluation, for example, 100 bores can then be measured in 3 s. Accuracy is also increased by measuring large areas with high magnification and averaging over several images, which improves the signal-to-noise ratio. The method can be customised to the requirements of the measurement task.

With Raster Scanning HD P, image acquisition only in areas of interest using a preset path results in a further reduction in measuring time and data volume compared to rectangular raster scanning of the entire workpiece with Raster Scanning HD N. On rotary axis devices, Raster Scanning HD ROTARY enables image acquisition during rotation with measurements on the "unrolled" overall image of the lateral surface of rotationally symmetrical workpieces.

Volume Section Sensor

With 2D contour image processing and the associated image processing filters, measurements can also be taken in any cross sections of the CT volume or point cloud. This makes it particularly easy to measure workpieces made of several materials, among other things. In addition to planar cross sections, cylindrical CT volume sections are also possible for reliable measurements with the Volume Section Sensor or inspection with WinWerth® VolumeCheck. The base area of the cylinder is not limited to circles and can take on any mould. As a result, both a 3D view of the cut surface and the unrolled 2D lateral surface of the cut cylinder are displayed.

Volume Section Sensor
 
Special measurement methods for computer tomography scans - Increasing the resolution and extending the measuring range through rasterisation
Special measurement methods for computer tomography scans

Increasing the resolution and extending the measuring range through rasterisation

In Raster Tomography, several sections of the measuring object are captured one after the other and the corresponding image stacks are saved. Scanning can be performed along the rotary axis (X-scanning), perpendicular to the rotary axis (Y-scanning) and in both orientations (XY-scanning). During the evaluation, the corresponding pixel or voxel information for the entire object is merged. This is done without stitching using only the highly accurate coordinate axes. The resolution is increased by capturing a small workpiece at a higher magnification with several grid steps, and the measuring range is extended by capturing a large workpiece in several sections.

Scan tomographically and metrologically link eccentric cut-outs in high resolution with Multi-ROI CT

Eccentric Tomography allows the workpiece to be positioned anywhere on the rotary table (patented). There is no need for complex and time-consuming alignment of the workpiece, which increases ease of use. Sectional tomography or ROI tomography (ROI: Region of Interest) is used to measure parts of the measuring object with high resolution without having to capture the entire measuring object, e.g. e.g. with Raster Tomography, which is time-consuming and memory-intensive. Multi-ROI tomography offers a combination of the benefits of eccentric and sectional tomography. Several high-resolution parts can also be selected at any position in the measuring object.

Scan tomographically and metrologically link eccentric cut-outs in high resolution with Multi-ROI CT
Werth ClearCT for low measurement uncertainties

Werth ClearCT for low measurement uncertainties

Werth ClearCT is based on a special combination of rotary axis and linear motion axes. In contrast to conventional cone beam CT, this allows an almost artefact-free CT volume to be generated. Time-consuming correction methods are no longer required, which enables reliable automatic measurement at high measuring speed and low measurement uncertainty.

Measuring multi-material workpieces with Dual-Spectra Tomography

In the X-ray tomographic measurement of metal-plastic components such as feeding connectors, the metal pins often cause artefacts due to beam hardening and scattered radiation, which make measurements on the plastic housing more difficult. In Dual-Spectra Tomography, the measurement software combines two CT measurements at different cathode voltages into one volume. The radiation spectra are matched to the two materials. The corresponding reduction of artefacts in the volume reduces the measurement uncertainty when determining the sizes of the different materials. To this end, the WinWerth® MultiMaterialScan uses the patented subvoxelling process to automatically calculate separate STL point clouds for each material from the CT volume data, even for several different metal components.

Measuring multi-material workpieces with Dual-Spectra Tomography
Reduction in measurement time through continuous rotation of the device axis with OnTheFly-CT

Reduction in measurement time through continuous rotation of the device axis with OnTheFly-CT

When scanning tomographically in conventional start-stop operation, the rotary motion is interrupted for the acquisition of each radiographic image so that no motion blur occurs during the exposure. OnTheFly Tomography makes it possible to save dead time for positioning the workpiece through continuous rotation. On the one hand, this method can greatly reduce the measurement time while maintaining the same data quality, and on the other hand, it can improve the data quality and thus the measurement uncertainty while maintaining the same measurement time.

Increasing automation

Measuring workpieces automatically

Regardless of how the programme is created, the measuring machine can process the measurement sequence automatically or semi-automatically (for manually operated machines). This means that the machine can also be used by users who do not know the test procedure in detail. Operation is reduced to inserting the parts, determining their position by measuring a coordinate system on the workpiece (pre-alignment) and starting the programme. The pre-alignment can be automated or even omitted by using fixtures. Such devices can also hold several workpieces at the same time (pallets). This reduces set-up times. The WinWerth® software then automatically repeats the measurement sequence at the various locations on the pallet.

Integrated into the production process

For users untrained in operating measuring devices, WinWerth® offers the option of simply selecting the part number and using it to start an automatic programme sequence. Alternatively, this can be done by scanning a barcode on the production order. Automatic fault handling helps, for example, if parts are not inserted correctly.

Alternatively, a workpiece changing system can be integrated into the housing of the TomoScope® coordinate measuring machines without any further precautions for radiation protection. With several ready-fed pallets, measurements can be carried out overnight and at weekends.

Automatic feeding by feeding devices can also be integrated. For this purpose, the measuring programmes can be prepared remotely at offline workstations. The workpieces are fed into the safety area of the robot via an airlock. The geometrical characteristics of workpieces such as valve blocks, housings and castings are determined almost every half minute, a nominal-to-actual comparison is carried out with the measuring point cloud of a master part and the workpieces are tested for defects such as burrs. The measurement results can be determined with the help of parallel evaluation computers and merged in a common protocol, including the measurement results of interlinked multi-sensor devices.

Integrated into the production process
Specific access to measurement results in production with WinWerth® Scout

Specific access to measurement results in production with WinWerth® Scout

The WinWerth® Scout user interface enables quick and easy access to all measuring processes in the company. Measurement orders that are still being processed are shown in a list. The current status, such as "Job started", "Tactile measurement" or "Evaluation", is displayed next to the job identification number. Completed orders are automatically moved to another list and colour-coded according to their status: green for "in tolerance", yellow for "action limit" and red for "out of tolerance".

If several workpieces are measured at the same time, one or more workpiece groups are created. If you click on a measurement job in the list of completed measurements, another window opens with a list of all measured workpiece groups or workpieces, the status of which is also colour-coded.

Clicking on the group or workpiece in the list view opens the WinWerth® 3D viewer. In the case of workpiece groups, an overview of the workpiece elements appears. The workpiece elements are displayed as spheres whose colour indicates the status of the workpieces. Right-clicking on the workpiece element of interest opens a selection list with the result displays for the respective workpiece.

 
Part-to-part deviation analysis

Deviations of the workpiece from the target state are colour-coded

To illustrate the deviation of the workpiece geometry from the target values, a comparison to the CAD data with a colour-coded display of the deviations in WinWerth® is suitable. This procedure is essential for checking free-form surfaces. For measurement, the areas of interest of the object are scanned or captured as a point cloud. WinWerth® then compares the measured values with the CAD model. The result is documented by vectorial or colour-coded display of the deviations to the CAD model. This evaluation can be carried out as part of the measurement sequence on the machine or in offline mode at a separate evaluation station. The colours of the measurement points illustrate the deviation between the target and actual values. In order to include the part tolerances in the visualisation, they are divided into four basic classes:

  • positive within tolerance
  • negative within tolerance
  • positive outside tolerance
  • negative outside tolerance

The amount of deviation is displayed using colour coding. Alternatively, the user can configure colour coding according to their requirements.

Part-to-part deviation analysis - Deviations of the workpiece from the target state are colour-coded
All options are open when selecting the datum system

All options are open when selecting the datum system

Depending on the task, the measurement results are either calculated or displayed in a reference coordinate system that has been measured beforehand (e.g. e.g. vehicle coordinates in automotive engineering) or in a coordinate system that has been generated by optimising the fit of selected surface areas relative to the CAD model.

The two fitting strategies WinWerth® BestFit and ToleranceFit® can be well illustrated using the example of a 2D cross section. In the first case, the position of the measured points is optimised by minimising the distances to the target points. As tolerances of different object areas are not taken into account when fitting, it is possible that tolerances are exceeded, although the tolerance could be maintained by moving the coordinate system. This method is therefore only suitable for quality control to a limited extent.

The optimisation criterion with WinWerth® ToleranceFit® is to keep the distance between the measurement point and the tolerance limit as large as possible or, if the measurement point is outside the tolerance limit, to keep the tolerance overrun as small as possible. Objects recognised as faulty according to the BestFit method (red areas present), but not actually faulty, can be classified as functional according to the ToleranceFit® method. The contour is checked as with a gauge.

Measurement results are fed back into the production process

In order to incorporate the measured or calculated deviations into the manufacturing process, the specification data can be modified largely automatically with WinWerth® FormCorrect. For this purpose, the deviations between the original CAD model and the measured data of a sample workpiece are determined and mirrored on the model. From this, the measurement software generates a corrected CAD model that can be used to compensate for systematic manufacturing deviations in the plastic injection moulding process and 3D printing. In contrast to conventional reverse engineering, the application is considerably simplified. Due to the high precision, only one correction loop is often required, meaning that the costs of the development process can be significantly reduced. For high-resolution corrections and for the modification of internal surfaces, the use of coordinate measuring machines with X-ray computed tomography is recommended. A similar procedure is possible with the 2D BestFit software. Mould correction can be used both for running in new cutting tools (profile grinding, form milling) and for correcting positioning deviations during wire EDM.

Measurement results are fed back into the production process
Automatic burr detection

Automatic burr detection

One of Werth's special features is the automatic detection and measurement of burrs or chips during the measurement sequence. The result is a colour-coded deviation plot of the burr and the maximum burr length. In the deviation display, only the points at which the burr length exceeds the tolerance limits are shown. The burr length along the entire burr can also be displayed numerically using analysis markers. For example, a flag is set every 0.5 mm to indicate the maximum local burr length.

 
Evaluate point clouds

Easily analyse point clouds from optical sensors or computer tomography scans

If no CAD data is available, the measurement points can be selected interactively by the operator. In WinWerth®, both direct selection with the mouse and automatic decomposition into standard geometry elements are possible. Starting from a starting point, further points are automatically added until the form error of the selected feature (e.g. e.g. cylinder) increases noticeably. This signals that the limits of the feature have been reached and the process is completed.

It is more effective to define the measurement sequences using 3D CAD data. Simply selecting CAD features automatically selects the necessary measurement points (patent). Based on the selection of CAD patches, all measurement points of the measured object that can be geometrically assigned to this patch are selected, taking into account the specified edge distances. This results in a complete capture of the mould of the corresponding feature with the maximum number of points.

In practice, it is common to define drawing dimensions in 2D views and cross sections. This must also be taken into account when analysing tomographically generated measured data. For this purpose, planes can be defined in the workpiece coordinate system and intersected with both the CAD target data and the actual point cloud. WinWerth® automatically extracts contours that represent the target data and the actual contours. The same software functions are used to evaluate the 2D sizes in cutting contours created in this way as are available for evaluating contours scanned using image processing or a stylus.

Evaluate point clouds - Easily analyse point clouds from optical sensors or computer tomography scans
 
Analysing volume data - Testing the material structure and analysing mounted assemblies
Analysing volume data

Testing the material structure and analysing mounted assemblies

WinWerth® also provides a selection of software tools for analysing material on the volume data. The visualisation of the volume data is integrated into the 3D module of the WinWerth® measurement software. The volume is visualised in the form of grey values representing the density of the material. In general, the volume becomes lighter as the density increases. Three different views can be used in parallel and faded in or out individually. It is possible to display the entire volume, i.e. all voxels with their respective grey value. In the "ISO surface" view, only voxels with the selected grey value are displayed. 2D cross sections can also be displayed according to the selection of the cross section plane. All variants are displayed in three dimensions and can therefore be analysed from all sides. CAD model, voxel volume and measurement point cloud are imaged superimposed in the same coordinate system.

The visualisation can be clipped using any definable planes (clipping planes). The model and measured data are hidden beyond the planes. The entire workpiece can be removed plane by plane and visually inspected for voids, for example. Material, internal geometries and individual components of multi-material workpieces can be tested using the clipping planes. Both the clipping planes and cutting edges for the visualisation and inspection of 2D cross sections can be moved and rotated in three dimensions directly in the 3D graphics using the mouse. Mouse clicks on the voxel volume now generate 3D surface points for alignment, which is now also possible without prior calculation of the measurement point cloud.

The histogram function can be used to vary the transparency for selected grey scale ranges and image the grey values on a colour scale. By varying the transfer curve in any sub-intervals, grey value or colour areas can be spread to increase the contrast. The transfer curve can now be defined once for a sample part and then saved for series measurement of similar workpieces. This ensures the optimum visualisation of each voxel volume for fast inspection.

Contact
Select another country or region to see content in your language.